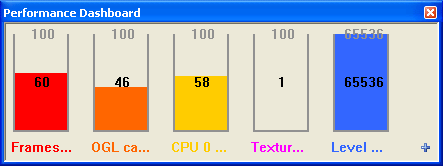
The Performance Dashboard view displays performance counters values as continuously changing vertical performance bars. These counters include: gDEBugger, operating system, and vendor specific graphic boards (NVIDIA and 3DLabs currently). For example: CPU/GPU idle, graphic memory consumption, vertex and fragment processors utilizations, number of function calls per frame, frame per second, etc...
